
How Many Single Women in USA?
Interactive unmarried female population waterfall analyzing 63.8 million single American women across 50 states, age slices, and metropolitan density zones.
Notice: This calculation engine models published statutory formulas and regulatory codes for informational and planning purposes only. It does not provide certified legal, medical, veterinary, tax, or engineering advice. For definitive rulings, consult an actively licensed professional in your jurisdiction.
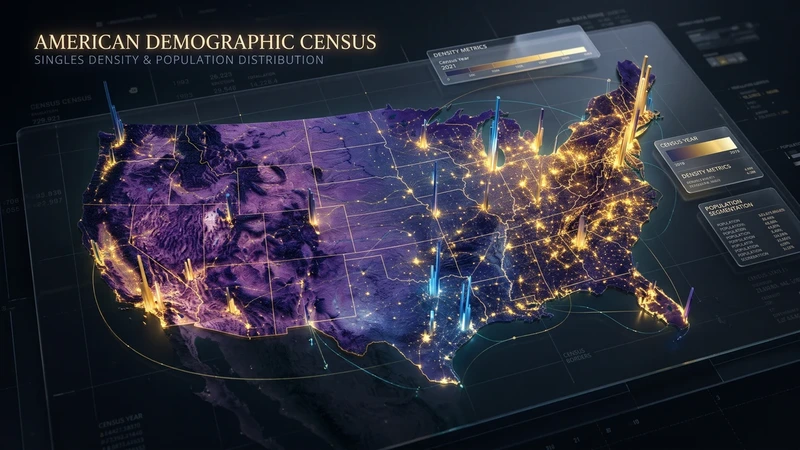
U.S. Census Findings: Mapping 63.8 Million Single Women
According to the 2026 U.S. Census Bureau CPS ASEC, there are 63.8 million unmarried single women aged 18 and older in the United States, representing 48.0% of the 133 million adult female population. Among women aged 18 to 29, 79.8% (21.4 million) are unmarried, dropping to 42.8% in ages 30–39.
The demographic structure of American single women reflects broader sociological shifts toward delayed marriage and increased economic independence. With the median female age at first marriage reaching 28.6 years nationwide, young adulthood is now predominantly an unmarried life stage.
Longitudinal analysis from the Bureau of Labor Statistics demonstrates that educational attainment strongly correlates with singlehood durations. Women holding bachelor's or advanced degrees comprise the fastest-growing segment of unmarried women between ages 25 and 34, reflecting investments in professional credentials and geographic mobility before partnership.
Regional density variations create localized micro-markets where sex ratios depart sharply from national averages. Coastal metropolitan areas frequently show a surplus of college-educated single women, whereas interior manufacturing and resource corridors maintain male surpluses, demonstrating that dating availability is fundamentally a localized geographic phenomenon.
Across the country, the distribution of single women is heavily shaped by urbanization and higher education enrollment. Major metropolitan hubs attract large cohorts of single women pursuing corporate, healthcare, and educational careers. To explore state-by-state gender imbalances and ratio differences, see our interactive National Demographic Census Atlas.
To calculate what percentage of these 63.8 million single women meet your specific criteria for height, income, and body composition, use our what percent of women meet your standards tool. You can also analyze urban dating pool attrition in the Dating Pool Statistics Calculator or return to the main Female Partner Calculator.
Unmarried Female Population by Age Cohort
Census data documents significant variation in single female availability across distinct lifecycle stages:
Ages 18–29 Cohort
Comprises 21.4 million single women. Peak unmarried stage driven by education, early careers, and delayed marriage.
Ages 30–39 Cohort
Comprises 9.8 million single women. Period of rapid marital formation with high career establishment.
Ages 40–49 Cohort
Comprises 7.5 million single women. Characterized by stability, career seniority, and post-divorce single populations.
Census Population Waterfall Architecture
The population waterfall model computes local single female availability by sequentially applying demographic and geographic filtering coefficients:
Census Demographic Population Waterfall Model
Variable Definition & Units
Estimated number of unmarried female residents matching selected age, state, and metro filters.
Baseline civilian non-institutionalized female population aged 18+ in the United States.
Percentage of adult women who are never married, divorced, or separated from Census CPS tables.
Empirical share of unmarried females residing in the selected target age bracket.
State-level population share and metropolitan density distribution factor.
Starting with 133,000,000 adult women, applying national unmarried rate (0.48), ages 18–29 share (0.335), and California geographic weight (0.113) yields approximately 2,416,000 young single women in California.
Frequently Asked Questions: Single Women in the USA
How many single women are there in the United States?
According to U.S. Census Bureau CPS ASEC data, there are approximately 63.8 million unmarried single women aged 18 and older in the United States, representing 48.0% of the nation's 133 million adult female population.
What percentage of women in their twenties and thirties are single?
Among American women aged 18 to 29, roughly 79.8% (21.4 million) are unmarried, with the vast majority being never-married. In the 30 to 39 age bracket, the unmarried rate declines to 42.8% (9.8 million single women).
Which US states have the highest number of single women?
California leads the nation with approximately 7.21 million single women, followed by Texas (5.24 million), Florida (4.32 million), and New York (4.06 million). On a percentage basis, Washington, D.C. has the highest concentration of single women (53.8% unmarried rate and a 0.86 male-to-female sex ratio).
How does geography impact the ratio of single men to single women?
Sex ratios vary significantly across regions. Energy and industrial states like Alaska (1.11 men per woman) and North Dakota (1.13) feature significant male surpluses, whereas East Coast urban hubs like Washington D.C., New York, and Philadelphia have female surpluses.
Explore the Dating Standards Demographic Research Lab
Five empirical simulators analyzing adult relationship probability, census distributions, and standards selectivity.
Joint probability engine filtering 133M adult women across age, height, income, and marital status. Computes exact statistical matching against U.S. Census Bureau CPS ASEC 2024 and CDC NHANES biological datasets.
Quantify the statistical rarity of the "6-6-6" benchmark across 127M adult American men. Evaluates height thresholds, six-figure earnings percentiles, and marital availability from official BLS wage surveys.
Psychometric evaluation scoring your romantic criteria from Grounded Realist to Statistical Unicorn Hunter. Benchmarks your standards across 15 behavioral, physical, and financial dimensions to compute your Selectivity Severity Index.
Multi-dimensional composite scoring evaluating aesthetics, career trajectory, fitness, and charisma. An objective demographic audit of adult desirability curves and peer percentiles based on Multi-Attribute Utility Theory.
50-state searchable census directory analyzing local singles density, gender ratios, and median ages. Comprehensive demographic directory comparing adult unmarried populations and regional sex ratios across all 50 U.S. states.